Techniques for writing an effective overview in Task 1 Writing
Mastering the Task 1 Overview
The most important paragraph in your essay.
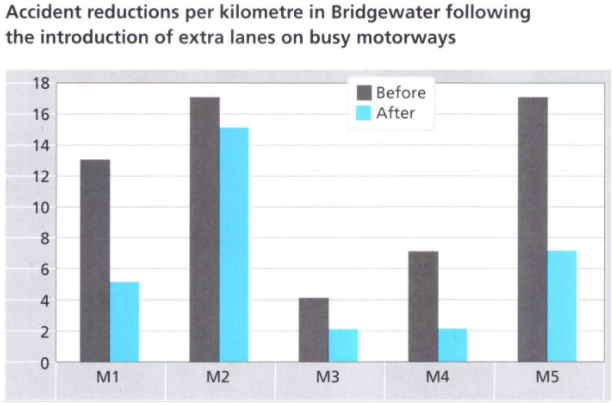
Case Study: Traffic in Bridgewater
Task: Describe the main trends shown in the bar chart illustrating the decrease in traffic accidents in Bridgewater after the installation of additional lanes.
Which overview is correct?
Option A (Mixed Results): Incorrect. The chart shows a clear decrease, not mixed results.
Option B (Popularity): Incorrect. Irrelevant data; the chart is about accidents, not popularity.
Option C (Traffic Volume): Incorrect. Focuses on traffic amount, not the *decrease in accidents*.
Option D (The Correct Overview):
"Overall, the chart illustrates a decrease in traffic accidents after the installation of additional lanes on busy roads."
Why? It accurately describes the main trend without specific numbers.
4 Golden Rules for Overviews
📝
Summarize
General trends only
🚫
No Numbers
Save data for body paragraphs
✂️
Be Concise
Keep it to the point
🎯
Accuracy
Reflect the data truly
Overview Templates & Examples
Click the categories below to see sample sentences.
📈 Trends Over Time
- "Overall, it can be seen from the chart that there was a steady increase in the number of tourists visiting the country from 2010 to 2019."
- "In general, the data indicates that the use of renewable energy has been increasing, while the use of fossil fuels has been decreasing."
- "What stands out is that earnings for 'Lovely Loaves' saw a substantial fall over the period."
⚖️ Comparisons & Correlations
- "Clearly, there were similar trends for male and female graduates, but the number of women increased at a higher rate."
- "Overall, the analysis reveals a gender pay gap, with men earning significantly more than women on average."
- "There is a strong correlation between exercise and mental health."
🔗 Cause, Effect & Impact
- "In every case, adding an extra lane had a positive effect on traffic incidents."
- "There was a significant rise in online courses in 2020, due to the COVID-19 pandemic."
- "The decline in public transport has resulted in more traffic congestion."
🔮 Future Predictions
- "Overall, these opposing trends mean that the death rate will probably overtake the birth rate in around 2041."
- "The table predicts a massive increase in the use of cars by 2020."
Related Articles
Effective Techniques for Commenting on Data in IELTS Graph Writing
Advanced Data Commentary Elevating your IELTS Task 1 Score Merely listing numbers prevents you from achieving a high band score. To boost your Task Achievement and Coherence scores, you must interpret and comment on the data effectively. 1. Using ...
Paraphrasing Techniques for Writing Task 1 Introductions in IELTS Academic Exam
IELTS Writing Task 1 Master Course: Paraphrasing Techniques Welcome to your comprehensive self-learning guide on Paraphrasing for IELTS Academic Writing Task 1. This lesson is designed to take you from the basics of vocabulary swapping to the ...
Understanding IELTS Task 1 Overview Statements
Understanding IELTS Task 1 Overview Statements A High-Level Lesson Using Real Band-7+ Models 1. The Universal Insight At first glance, samples look different, but every strong overview follows this formula: ? Overall trend(s) + Key comparison(s) + ...
Examples of IELTS Writing Task 1 Essays: More than 6 Bands
From Band 6 to Band 8 A Comparative Analysis of Writing Task 1 The Prompt The chart below shows the main reasons why people in the UK ride bicycles to work (survey results). (Data Points: Health: 50% Women/50% Men | Pollution: 30% Women/15% Men | ...
IELTS Writing Task 1: Maps & Plans
The Ultimate Guide to IELTS Maps Vocabulary, Tenses, and Structure for Band 7+ 1. The 4-Part Structure A. The Introduction (Paraphrase) Never copy the prompt. Use synonyms to rewrite the question statement. Prompt: "The maps show the developments in ...